Appearance
Board Statistics
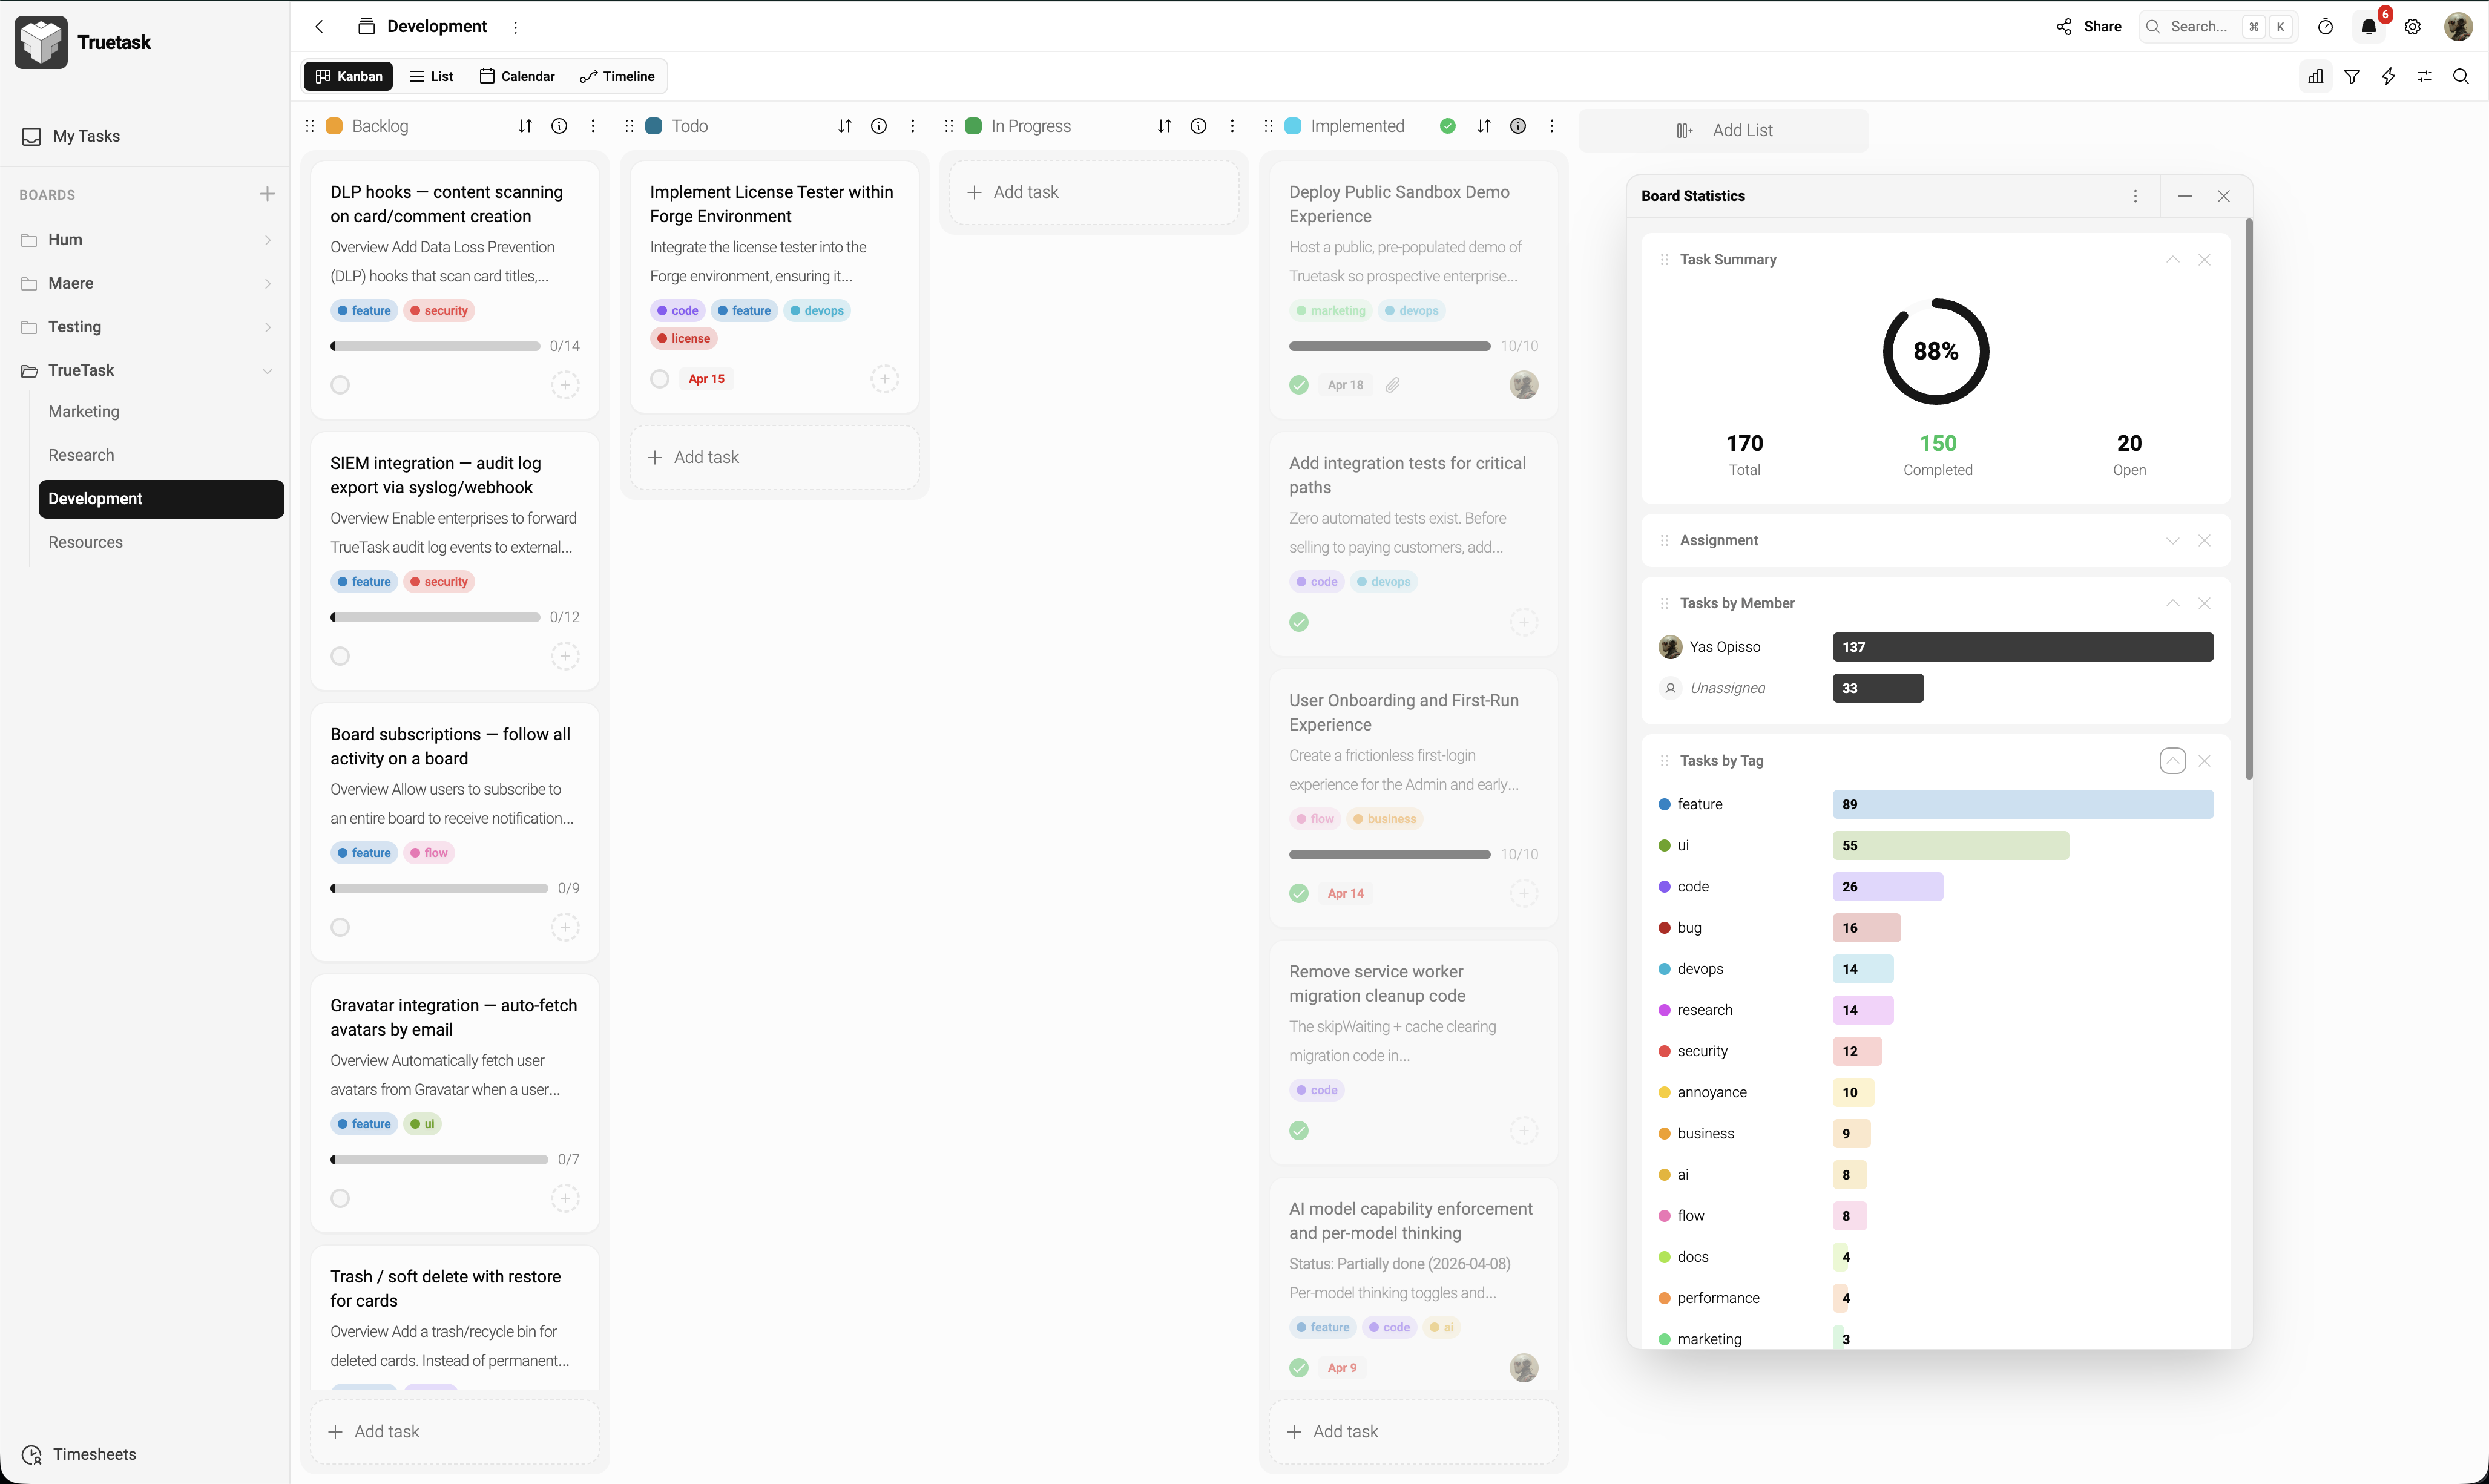
The Board Statistics panel shows charts and numbers about the current board — task counts, completion rates, workload distribution, and more. It's the quickest way to spot bottlenecks, workload imbalances, and progress trends.
Opening the Panel
Click the Statistics icon in the board toolbar. The panel slides open alongside the current view and can stay open as you move tasks around.
Statistics update in real time — every change reflects immediately, so you can watch trends as they happen.
Widgets
The panel is a dashboard of resizable, rearrangeable widgets:
| Widget | What it shows |
|---|---|
| Task Summary | Total tasks, completed vs open, overall completion percentage |
| Overdue Tasks | Count and list of tasks past their due date |
| Priority Breakdown | Bar chart of tasks grouped by priority level |
| Member Breakdown | Tasks assigned per member — highlights workload imbalance |
| List Distribution | Tasks per list — shows where work is piling up |
| Tag Distribution | Most-used tags with counts |
| Assigned vs Unassigned | Pie chart of tasks with members vs without |
| No Due Date | How many tasks are missing deadlines |
Customizing
- Drag widgets by their header to rearrange the panel
- Resize widgets by dragging the edge between them
- Expand a widget to full-screen view by clicking its expand icon
Your arrangement is saved per board.
Filters Apply
Any filter applied to the board view also narrows the statistics. This is useful for:
- Current sprint only (filter by tag) — see that sprint's progress
- A single team member — see their individual workload
- Specific list — see the pipeline stage health
Tips
- Statistics are board-scoped — they don't aggregate across multiple boards. For cross-board analytics, use the Insights page.
- Use the Member Breakdown to spot overload early
- Watch Overdue Tasks trend to identify capacity issues before they grow