

Appearance
Board stats
The stats panel answers two questions: where the board stands right now, and which way it is moving. This page covers the panel itself and every widget in it.
Opening the panel
Click the chart button in the board tools tray, or use Stats in the views menu. It is available on the four task views (Kanban, List, Calendar and Timeline) and not on database boards.
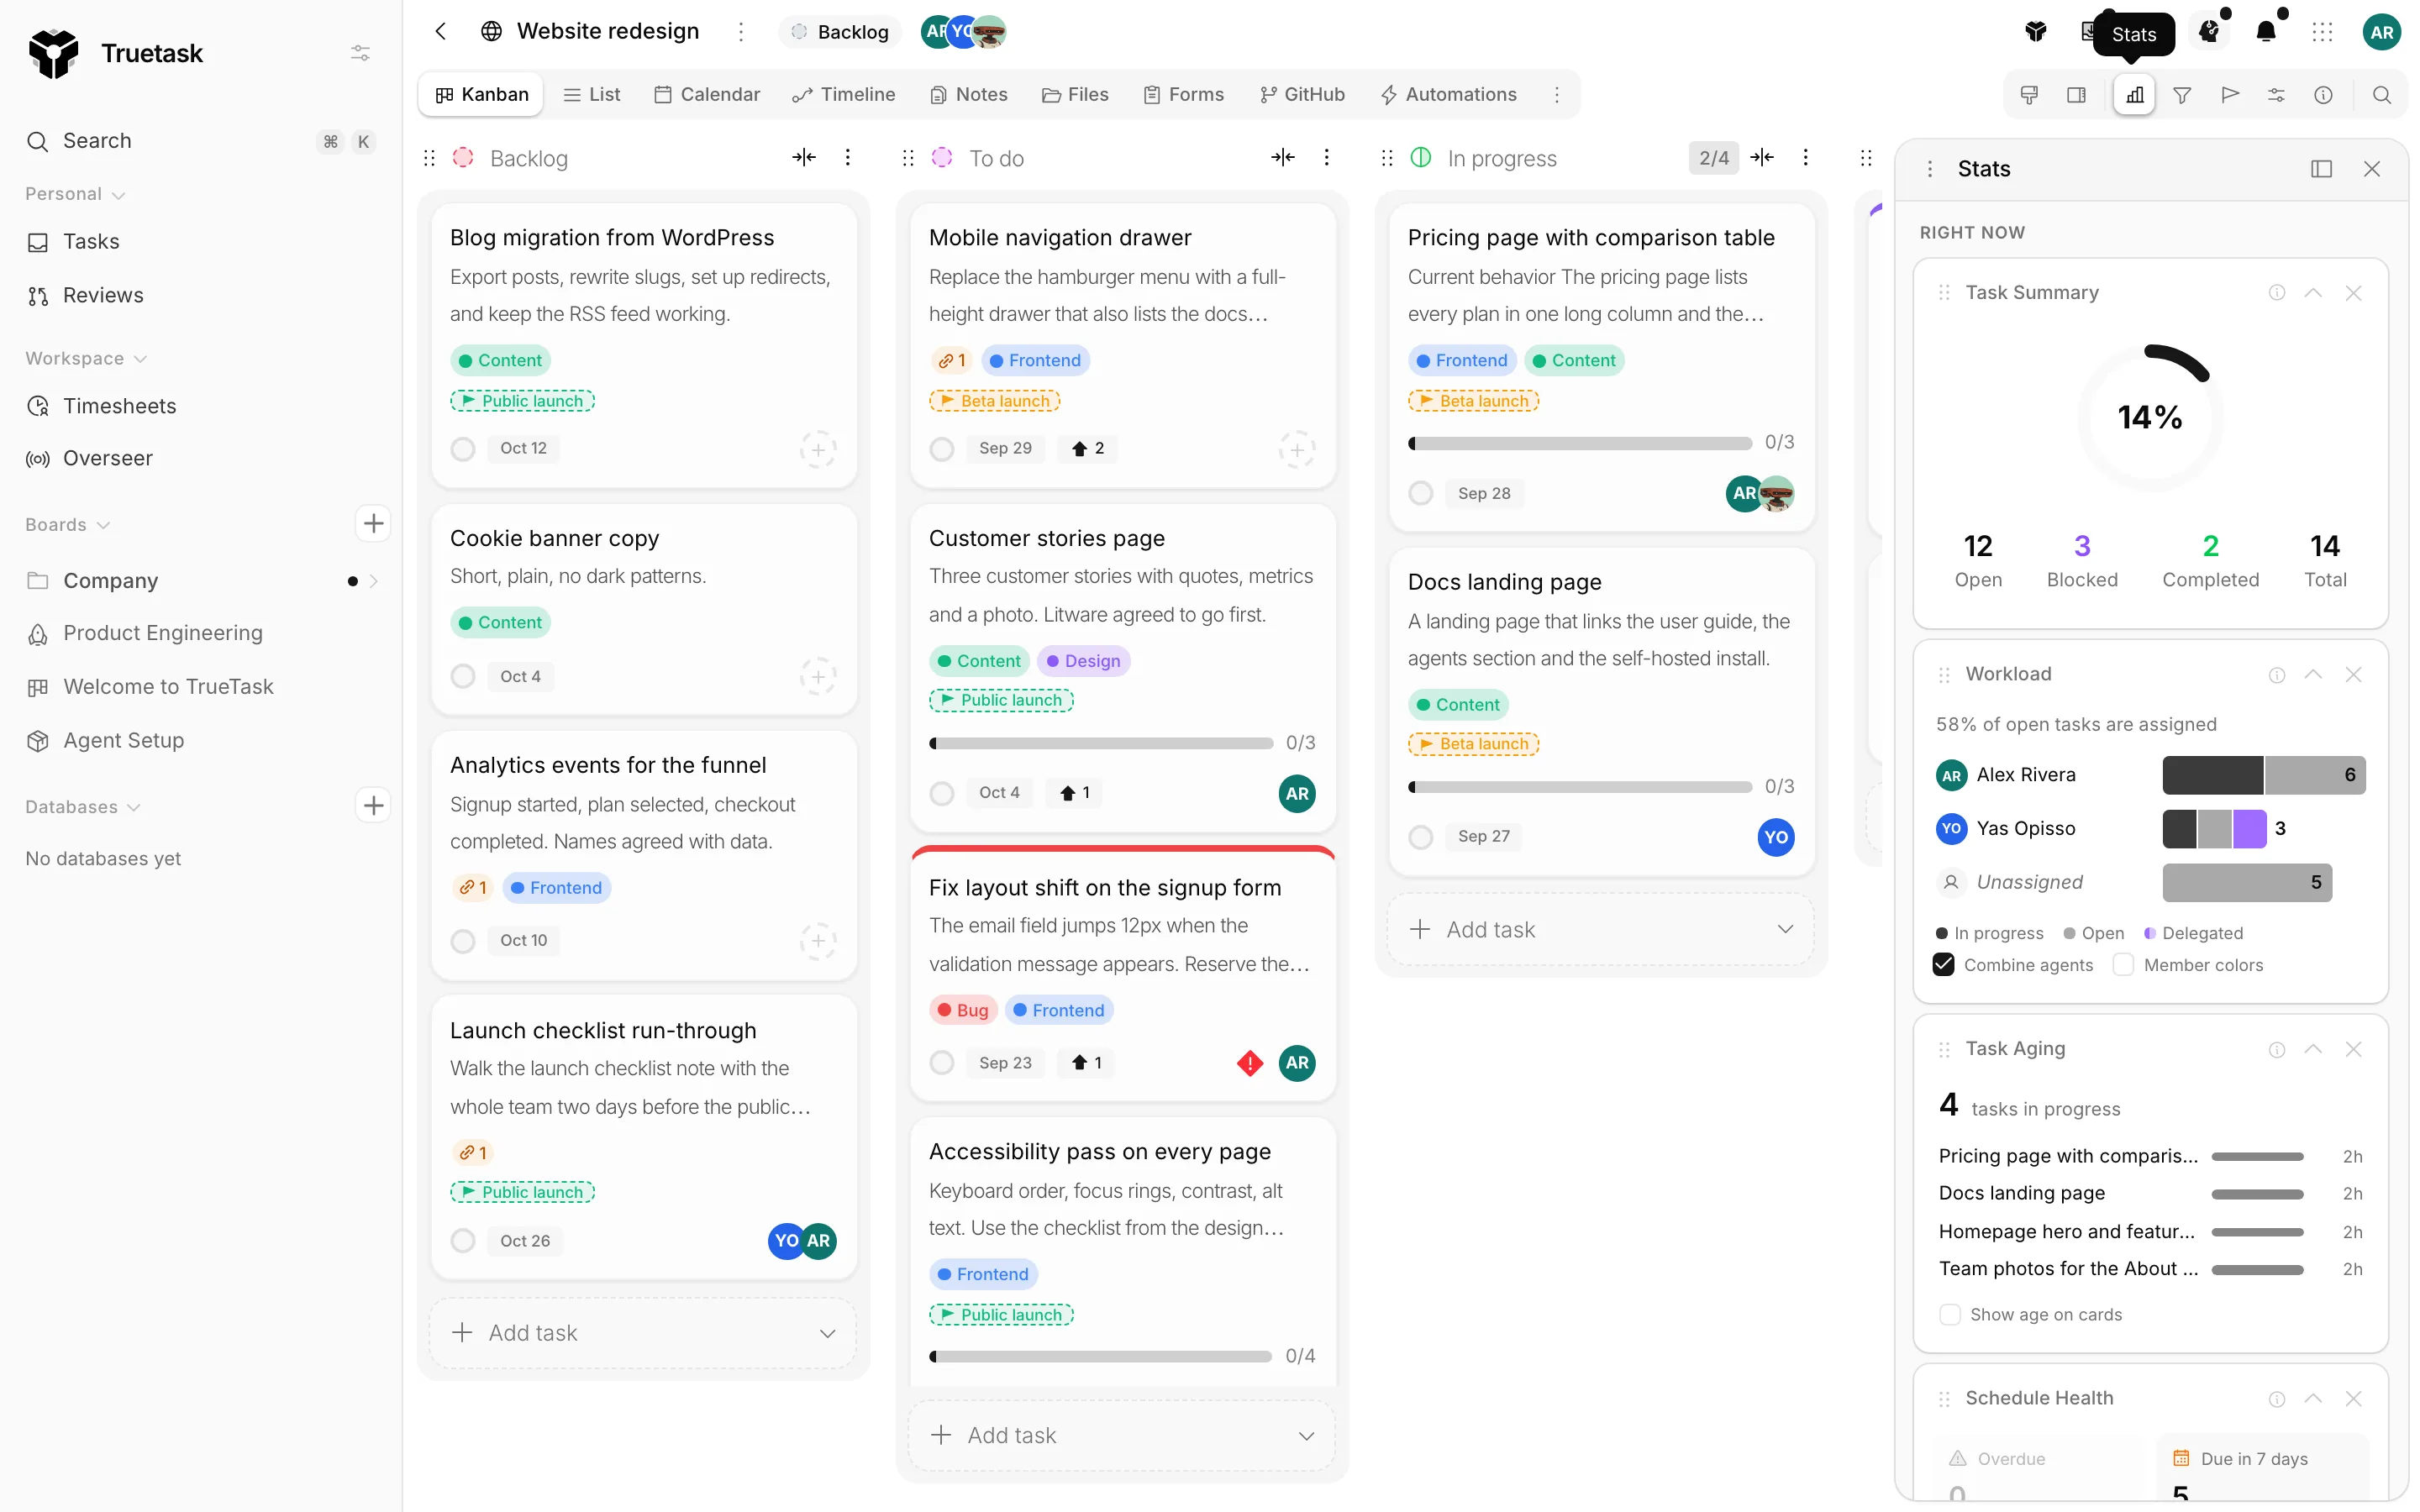
Switch to a view the panel does not cover and it is suspended rather than closed: it comes back when you return to a task view.
Placement
The panel's Placement menu offers Floating, Dock left and Dock right. While floating you can drag it by its title bar and resize it, and dragging it near a side snaps it into that dock. Its position is remembered.
Minimize collapses the panel to its title bar. Each widget also has its own caret to fold just that widget away, and an X to hide it.
Show/Hide Widgets in the title bar lists every widget, hidden or not, with Show all and Hide all. Drag a widget by its grip, in the panel or in that menu, to reorder it. Widgets stay in their section: nothing moves between Right now and Trends.
Right now
These widgets read the board as it is, and most of them follow the board's filters.
| Widget | What it shows |
|---|---|
| Task Summary | Where the board stands: open, blocked, cancelled, completed and total tasks in the current filter. Click a number to filter the board to those tasks. |
| Workload | Who is carrying what. Bars split each person's tasks into in progress and open, with unassigned work at the end. When the board sets a per-person WIP limit, the n/limit figure shows real utilization. Click a row to filter to that person. |
| Task Aging | How long in-progress tasks have been sitting there. Tasks in progress longer than most tasks take to finish are flagged as stuck. |
| Schedule Health | Deadline hygiene at a glance: overdue, due in the next 7 days, missing a due date, and blocked by dependencies. Click a tile to filter the board to those tasks. |
| Tasks by List | How tasks spread across the board's lists. Click a column to filter the board to that list. |
| Tasks by Tag | Which tags carry the most work. Click a tag to filter the board. |
| Tasks by Priority | How tasks distribute across priorities. Click a row to filter the board. |
Two widgets carry their own switches. Workload has Member colors and Combine agents, which folds each agent into its owner's row and shows delegated work in violet. Tasks by List has Skip finished lists, so a large Done column stops dwarfing everything else. Task Aging has Show age on cards, which is the same dimming as the Kanban style option.
Trends
These widgets are built from daily snapshots of the whole board, taken overnight.
| Widget | What it shows |
|---|---|
| Cumulative Flow | How many tasks sat in each list, day by day. Widening working bands mean work is piling up faster than it finishes. |
| Throughput | How many tasks the board finishes per week, with a rolling average for the trend. Follows the member filter. |
| Burndown | Open tasks over time. A falling line means the board finishes work faster than new work arrives. |
| Cycle Time | How long tasks take from start of work to done. Each dot is a completed task, and the lines mark where most land: 85% finish under the orange line, half under the gray one. Follows the member filter. |
One range control sits in the Trends header and every trend widget follows it: 7d, 30d or 90d.
Trends need history
The snapshot runs once a day, so a new board has nothing to chart until the next morning. The widgets say Daily snapshots start collecting overnight until they do.
A Whole board badge sits on the widgets built from snapshots, because that history cannot follow the board's filters. It lights amber while filters are active, so the mismatch is visible exactly when it would mislead you.
Click to filter
Most of the Right now widgets are clickable. Clicking a number, a tile, a column, a tag, a priority or a person sets the matching filter on the board, and the board narrows underneath the panel. Clear it from the filters dropdown. See Filters and search.
Where the numbers come from
Cycle Time measures from the moment work starts to the moment it is done, so it depends on the board having an In Progress lane. Task Aging measures the same start and flags anything sitting longer than most tasks take to finish. Task Summary counts cancelled separately from completed, because cancelled work left the flow without finishing.
All three follow the flow lanes. If the numbers look wrong, check the board's flow first. See Board flow and WIP limits.
Related
- Board flow and WIP limits for the lanes these charts read
- Filters and search for the filters the widgets set
- Overseer for the same questions across every board
- Views for which views the panel appears on