

Appearance
Timeline
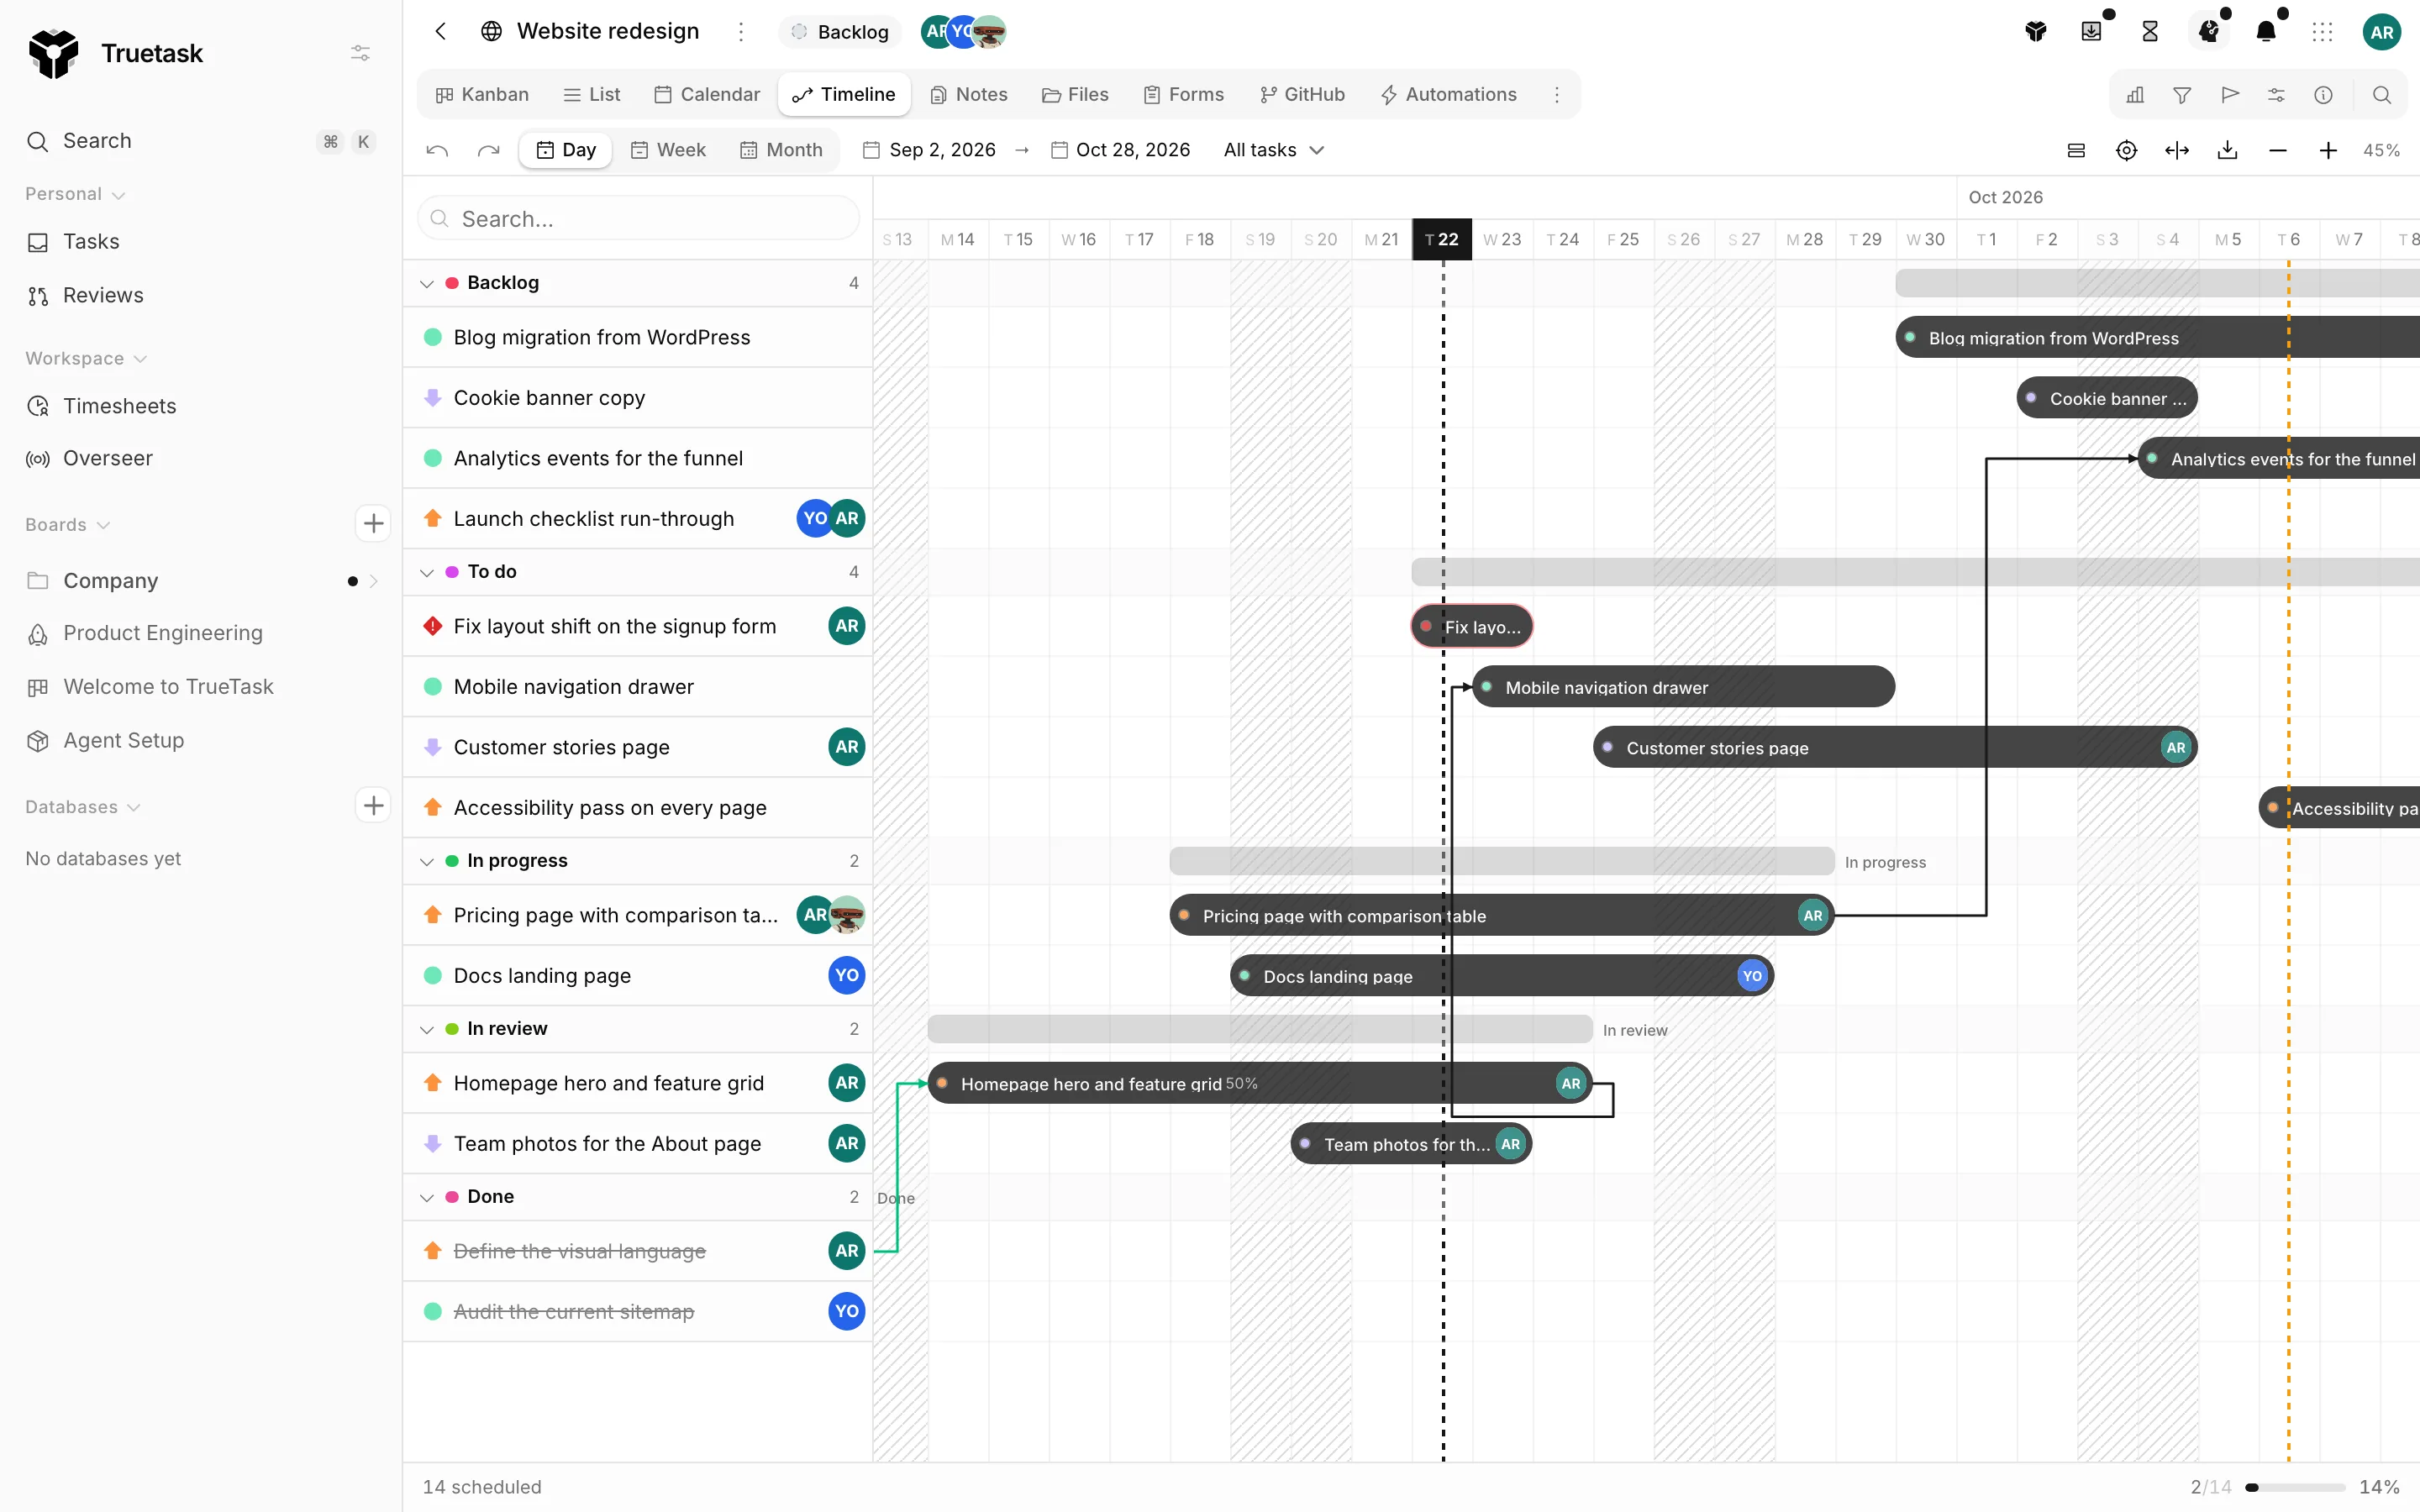
The Timeline view is the board on a time axis: a task list on the left, a bar chart of dates on the right. This page covers zooming and ranging the axis, moving bars, drawing dependencies and scheduling undated work.
The axis
Three tabs set the zoom: Day, Week and Month. The zoom follows the axis, so zooming far out past a threshold switches the mode for you, and picking a mode by hand pins it.
Hold Alt and scroll to zoom smoothly around the pointer. Scroll without a modifier to pan sideways. The zoom percentage and a minimap sit at the right end of the toolbar.
A select next to the zoom tabs sets the date range:
| Range | What it shows |
|---|---|
| All tasks | Everything the board has dates for. |
| This week | The current week. |
| Upcoming month | The month ahead. |
| Current month | The calendar month you are in. |
| Next 3 months | The quarter ahead. |
| Milestones | The span from the first milestone to the last. Off when the board has no milestones. |
| Custom | Whatever you set with the two date pickers beside the select. |
Today in the toolbar scrolls the axis to the current date. Fit to content zooms so every visible task fits at once. The download button exports the whole chart as an image.
Bars
A task with a start date, a due date, or both is drawn as a bar. Bars carry a shaded portion for checklist progress and, when there is room, the percentage. Overdue work is marked, and a task whose dates fall outside the visible range shows an arrow at the edge you can click to jump to it.
Drag the middle of a bar to move the whole task. Drag either end to change just that date. Undo and redo buttons in the toolbar reverse a drag: Cmd/Ctrl+Z and Cmd+Shift+Z or Ctrl+Y.
Right-click a bar for the task menu, which includes Unschedule to strip its start and due dates and send it back to the undated rows.
Undated tasks
Tasks with no dates still get a row, with an empty lane instead of a bar. Drag across that lane to draw the task's span and schedule it in one gesture.
The bar at the bottom of the window reports how many tasks are scheduled and how many are not, plus the overdue count.
Grouping and searching
The Group control in the timeline toolbar uses the same grouping as the List view, so a grouping set in one shows up in the other. Groups are collapsible and their header draws a bar spanning the earliest to the latest dated task inside.
A search field in the task list narrows the rows by title. The board's filters and quick search apply here too. See Filters and search.
Dependencies
Hover a bar and two handles appear at its ends. Drag the left one onto another task to add a blocker, and the right one to add a task this one blocks. The links are drawn between the bars, and clicking a link lets you remove it.
Dependencies created here are the same records the task frame shows. See Dependencies.
Milestones
Milestones appear as dated markers across the chart, so a plan reads against the dates that matter. Only milestones that are not hidden are drawn. See Milestones.
Pipelines
When the board has pipelines, a second select filters the chart down to one of them. A pipeline task with no dates yet shows its position in the run order where its bar would be, so the sidebar title never shifts. See Pipelines.
Related
- Calendar for the same dates on a grid
- Milestones for the markers on the axis
- Dependencies for what the links mean
- List for the grouping this view shares